
Most lists of employee retention strategies read alike: pay well, recognize good work, offer flexibility, invest in development. None of that is wrong. The trouble is that a list of fourteen equally weighted tips gives the owner of a 60-person company no way to decide where the first dollar and the first management hour should go. Turnover research can help with exactly that decision, because it has spent decades measuring which conditions come before people leave, and how strongly.
This guide works through that evidence for U.S. employers with roughly 10 to 250 employees. It starts with current quit data from the Bureau of Labor Statistics, explains the models researchers use to understand why people leave and why they stay, ranks the common retention levers by the strength of the evidence behind them, and ends with formulas, a worked cost example and a 90-day plan. Where the research is thin, we say so.
Where U.S. quit rates stand in late 2026
The Bureau of Labor Statistics (BLS) counts voluntary departures every month in its Job Openings and Labor Turnover Survey (JOLTS). In the release published on November 3, 2026, quits rose to 3.4 million in September, and the quits rate was 2.1 percent of employment. Compared with September 2025, quits were up by 375,000. These figures are preliminary and will be revised; data for October are scheduled for December 1, 2026.
A monthly rate of about 2 percent sounds small. Repeated for twelve months, it adds up to departures equal to roughly a quarter of the workforce, although part of that churn comes from the same hard-to-fill positions turning over more than once. The spread between industries is wide. In September, the quits rate was 5.0 percent in accommodation and food services and 0.9 percent in finance and insurance.
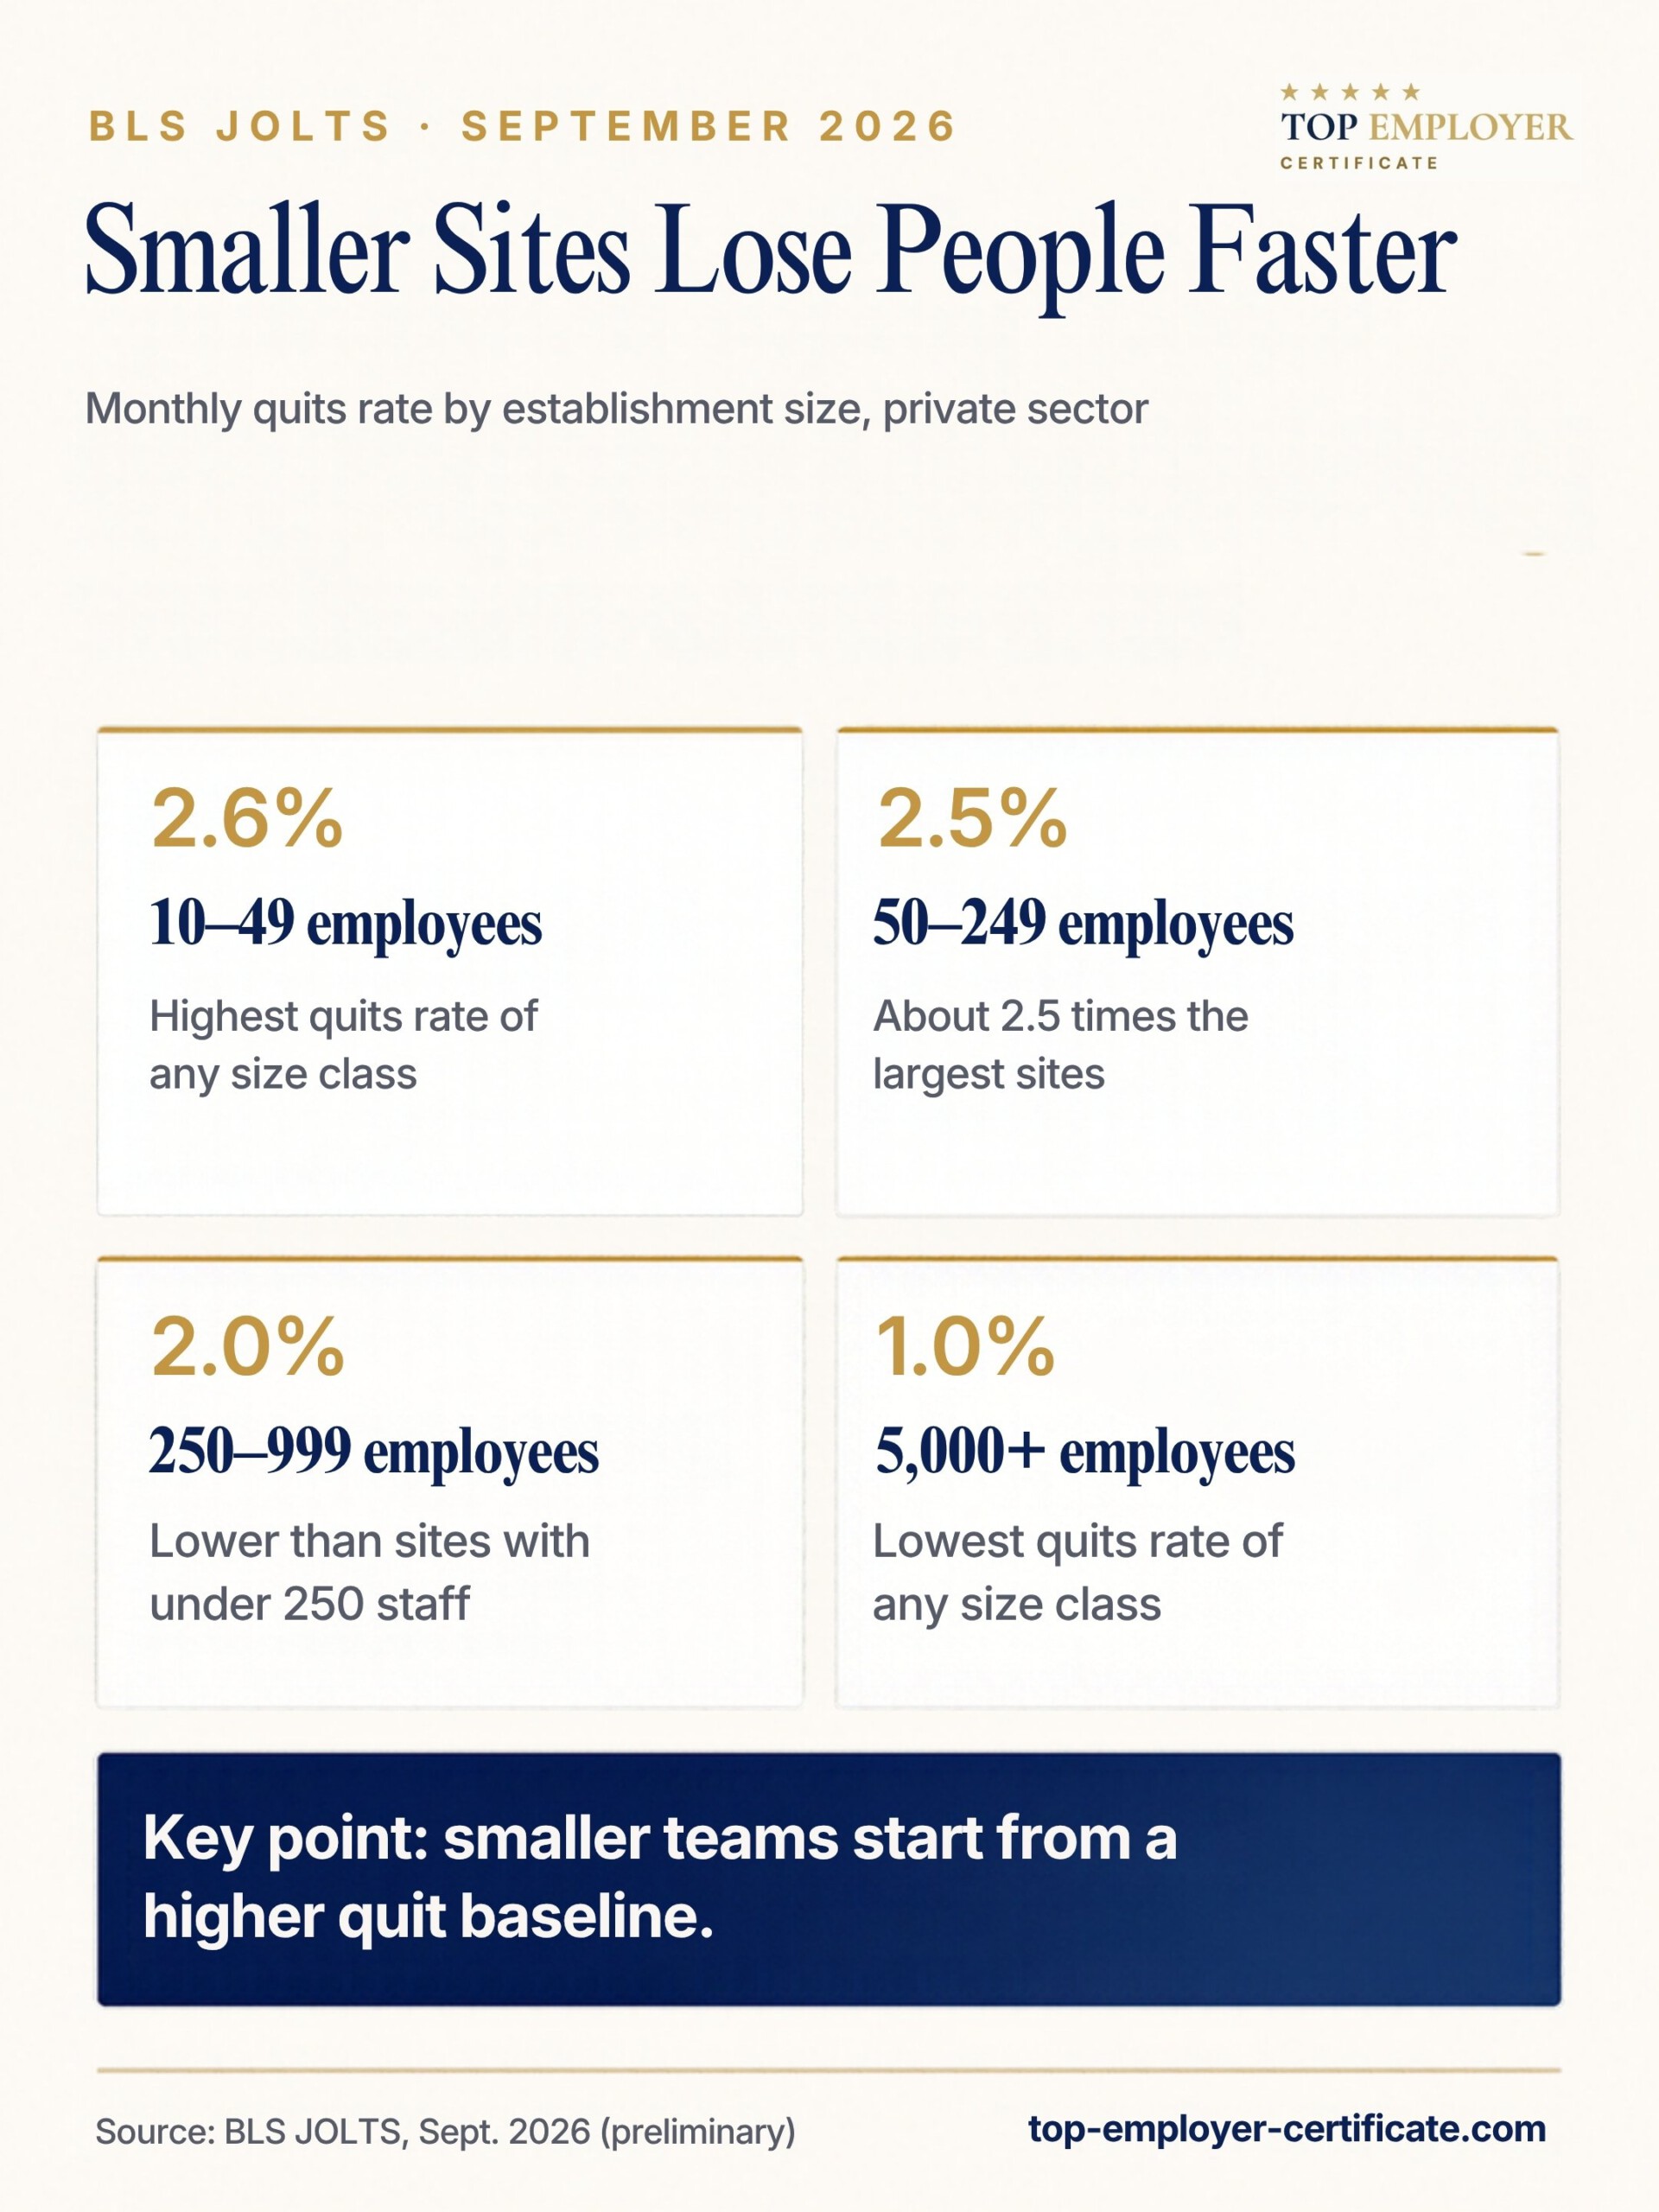
The detail most retention articles skip is size. JOLTS also reports quits by establishment size, meaning the size of a single location rather than the whole company, and the pattern is hard to miss:
| Establishment size | Quits rate, September 2026 |
|---|---|
| 1 to 9 employees | 2.2% |
| 10 to 49 employees | 2.6% |
| 50 to 249 employees | 2.5% |
| 250 to 999 employees | 2.0% |
| 1,000 to 4,999 employees | 1.7% |
| 5,000 or more employees | 1.0% |
Private sector, seasonally adjusted, preliminary. Source: BLS, JOLTS news release for September 2026 (Table 7).
Locations with 10 to 249 employees lost people at about two and a half times the rate of the largest establishments. Part of that gap reflects industry mix, since restaurants and stores tend to be small locations. Still, the typical employer in this size range starts from a higher baseline and has fewer people to absorb each departure. When one person leaves a team of twelve, a twelfth of the team’s know-how leaves with them.
Why people leave, and why they stay: three models worth knowing
Retention advice makes more sense once you know the frameworks behind it. Three of them explain most of what follows.
The desire to leave and the ease of leaving
The first formal turnover theory, published by James March and Herbert Simon in 1958, splits the decision in two: how much a person wants to leave, which is mostly a matter of job satisfaction, and how easy it is to leave, which is mostly a matter of alternatives in the job market. Rubenstein and colleagues describe this pairing as the starting point of the modern turnover literature. It explains why quits rise in a tight labor market even when nothing changes inside a company, and why an unhappy employee may stay for years when local alternatives are scarce.
The unfolding model: not every resignation starts with dissatisfaction
Thomas Lee and Terence Mitchell’s unfolding model (1994) describes several paths out of an organization, and not all of them begin with growing unhappiness. Some people also quit without another job lined up. For managers this has a practical consequence: a team can look content in last spring’s survey and still lose people this fall. A survey helps here only if it measures the right things; our guide to employee engagement survey questions explains how to build one. Changes the employer controls, such as a new supervisor, a different schedule or a promotion that went to someone else, deserve as much attention as slow-moving attitudes.
Job embeddedness: the reasons people stay
Mitchell, Holtom, Lee, Sablynski and Erez (2001) turned the question around. Instead of asking why people quit, they asked what keeps them. Their answer, job embeddedness, has three parts: links to colleagues, teams and the community; fit between the job, the organization and a person’s life; and sacrifice, meaning what someone would give up by leaving. In their study, embeddedness predicted voluntary turnover over and above job satisfaction, organizational commitment, job alternatives and job search. That makes it useful for practice, because links and fit can be designed, while general satisfaction is hard to move head-on.
What the research says about who quits
The most comprehensive summary is a meta-analysis by Alex Rubenstein, Marion Eberly, Thomas Lee and Terence Mitchell, published in Personnel Psychology in 2018. The team pooled 316 primary studies with about 1,800 effect sizes covering 57 possible predictors of voluntary turnover. Only studies that measured the predictor before anyone left, and that tracked actual departures rather than stated intentions, were included. About 79 percent of the samples came from the United States, and the average turnover rate across samples was 23.5 percent.
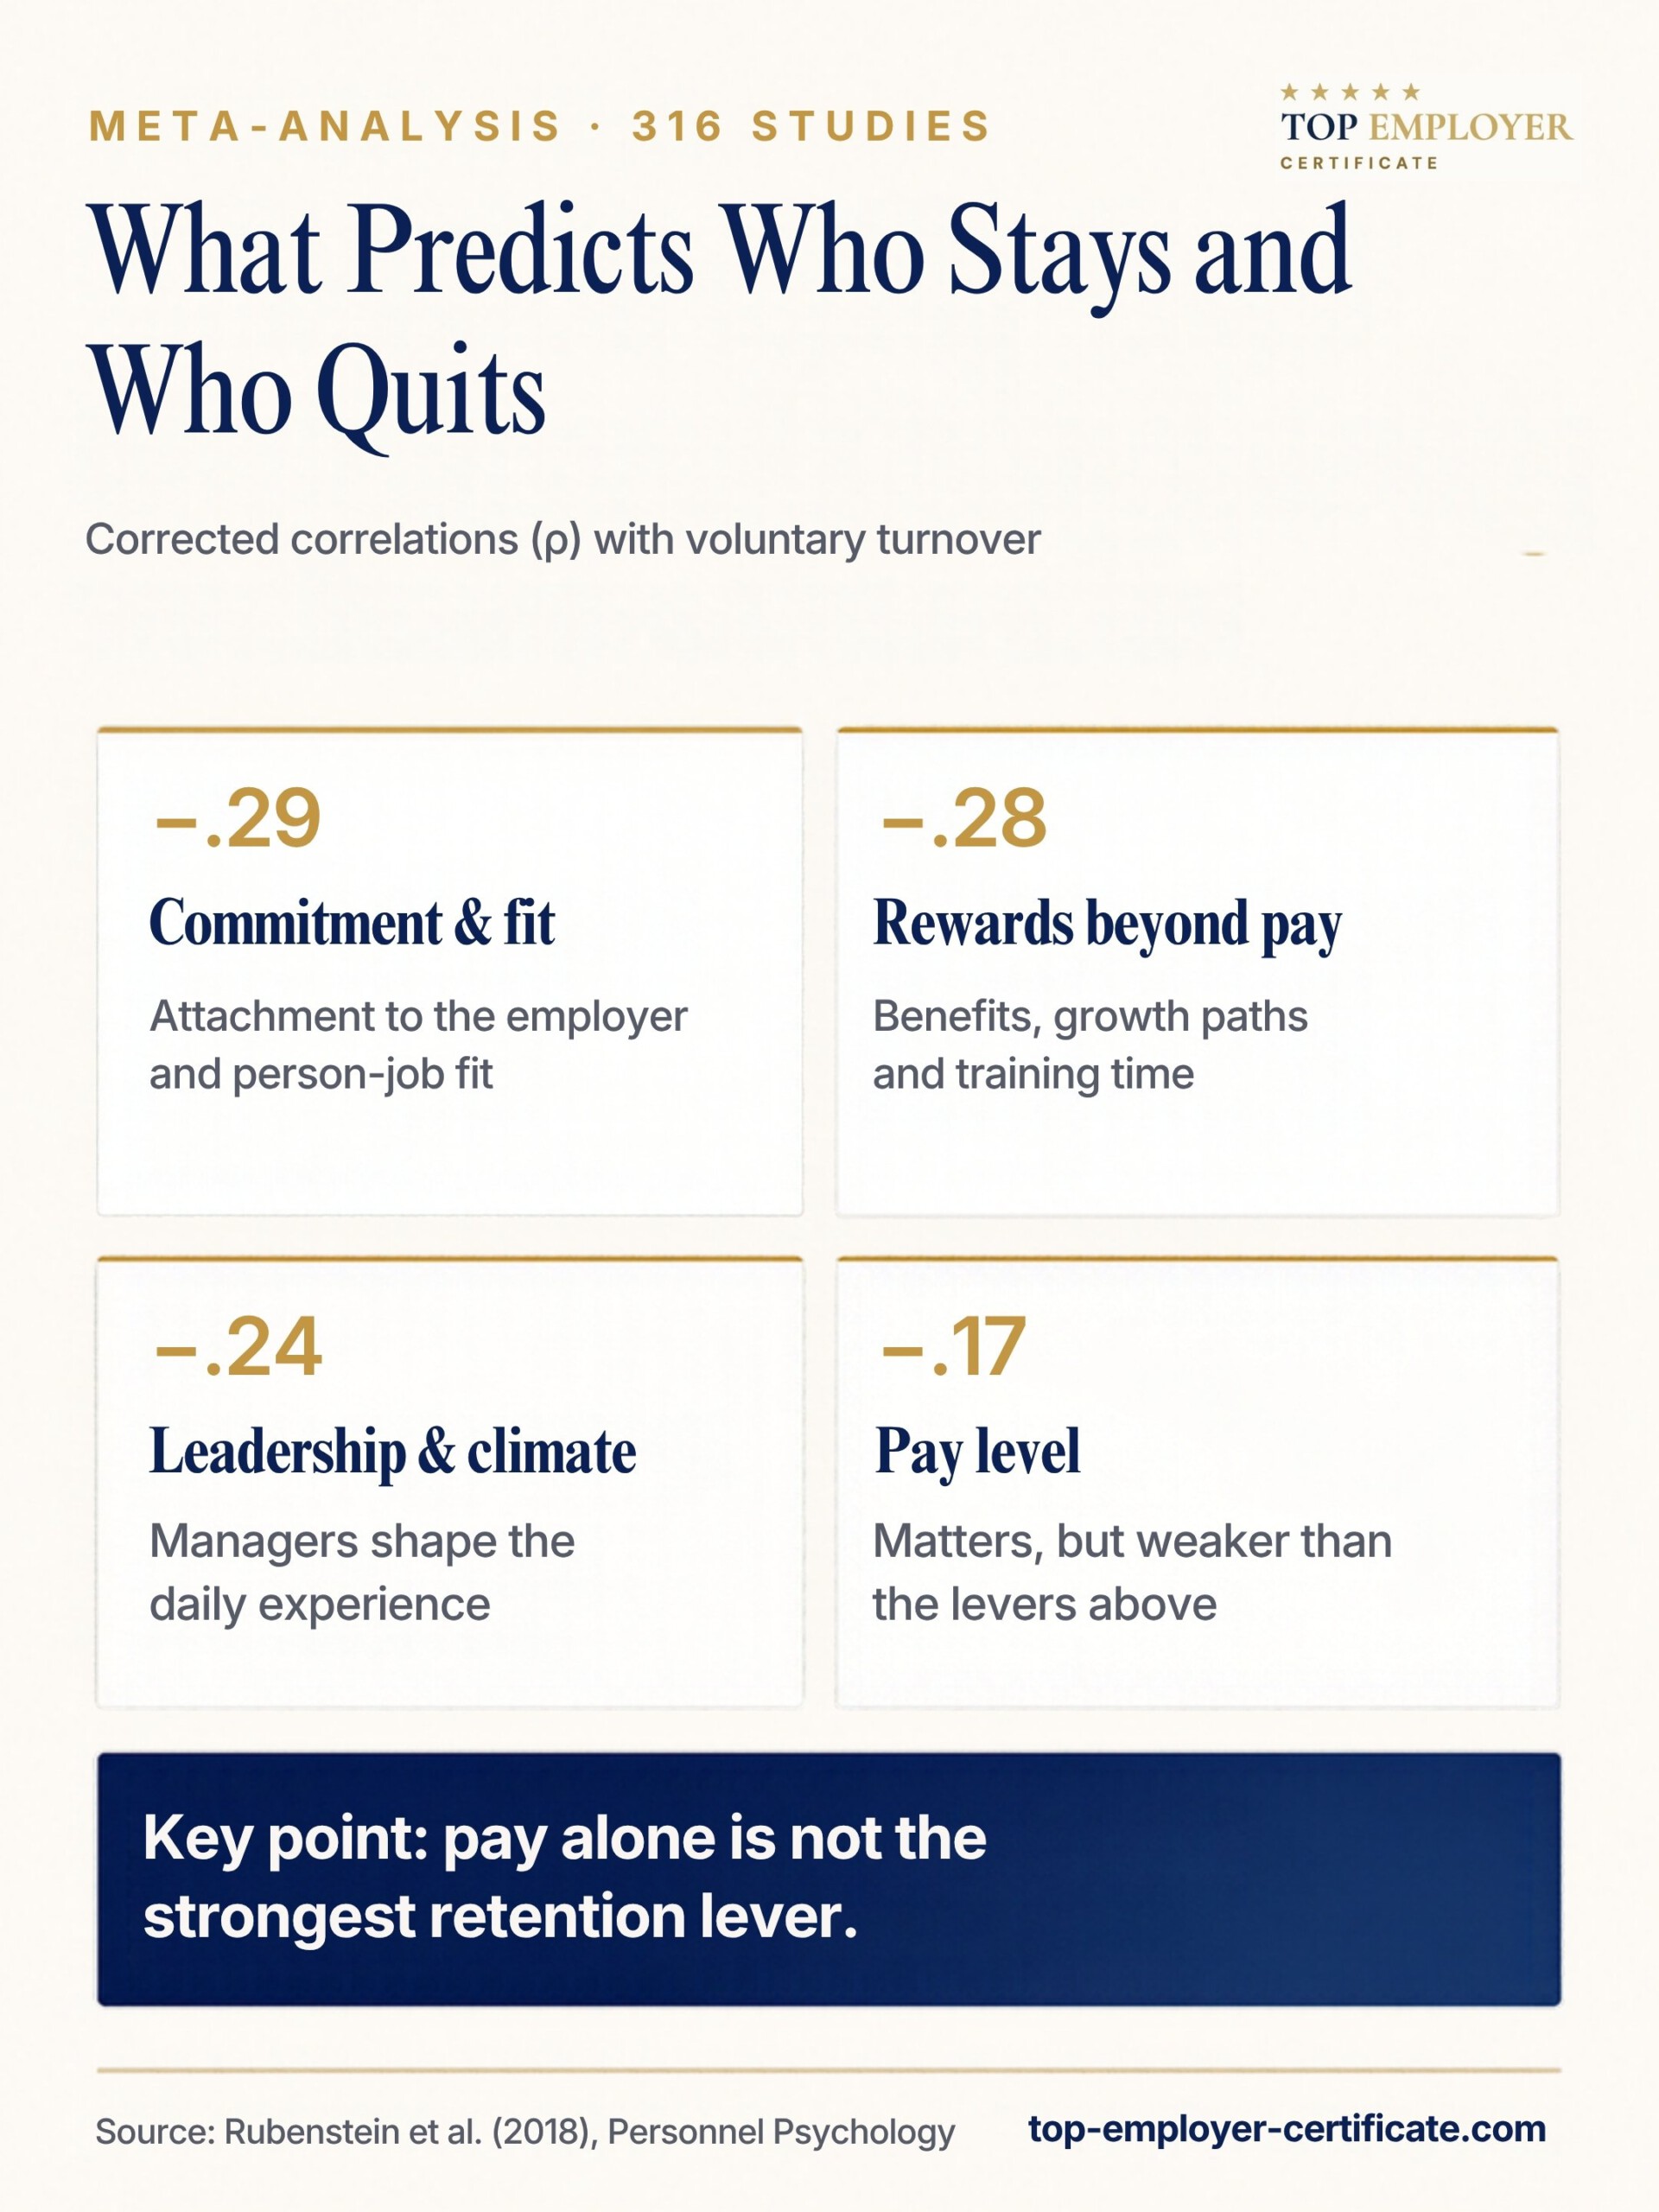
The results are reported as corrected correlations (ρ) between each factor and later quitting. A negative value means that more of the factor goes along with less turnover. Values between .15 and .30 can look modest, but quitting is a single yes-or-no event with dozens of causes, so no one factor is expected to explain much by itself. For decision makers, the ranking is what counts: which levers are consistently stronger than others.
| Factor | ρ with voluntary turnover | What it covers |
|---|---|---|
| Thoughts of quitting | +.56 | Intentions to leave, thinking about quitting, plans to search |
| Active job search | +.40 | Concrete steps to find another job |
| Organizational commitment | −.29 | Attachment and loyalty to the employer |
| Fit | −.29 | Match between the person and the job or organization |
| Job satisfaction | −.28 | Overall liking of the job |
| Rewards beyond base pay | −.28 | Benefits, career and growth opportunities, training time |
| Job embeddedness | −.26 | Links, fit and sacrifice on and off the job |
| Leadership | −.24 | Quality of the leader relationship and leadership style |
| Climate | −.24 | Shared perceptions of the work environment |
| Job security | −.23 | Confidence in stable employment |
| Job alternatives | +.23 | Perceived or actual options elsewhere |
| Stress and exhaustion | +.21 | Strain, burnout, emotional exhaustion |
| Work-life conflict | +.19 | Work interfering with life outside work, and the reverse |
| Perceived organizational support | −.19 | Belief that the employer values one’s contribution and well-being |
| Job characteristics | −.18 | Variety, task identity, significance, autonomy, feedback |
| Pay level | −.17 | Base salary and commission |
| Justice | −.17 | Fairness of outcomes, procedures and treatment |
| Coworker relations | −.14 | Support and cohesion in the team |
| Met expectations | −.12 | Whether the job matches what people expected |
| Organization size | +.03 | Number of employees |
Source: Rubenstein, Eberly, Lee & Mitchell (2018), Table 2. Selected predictors.
Four patterns stand out.
- The clearest warning signs are close to the decision. Thinking about quitting and looking for jobs predict departures far better than anything else. That is not a strategy in itself, but it shows why regular, honest conversations catch more risk than an annual survey alone. The authors also caution that intentions are not the same as behavior; plenty of people who think about leaving stay.
- Attitudes toward the employer matter as much as attitudes toward the job. Commitment and satisfaction now show nearly identical effects (−.29 and −.28). In the earlier meta-analysis by Griffeth, Hom and Gaertner (2000), commitment was the stronger of the two (−.23 against −.19).
- Pay matters, but it is not the strongest lever. Pay level came in at −.17, behind leadership, climate, fit and rewards beyond base pay. Griffeth and colleagues had found weaker effects still for pay (−.09) and pay satisfaction (−.07), while noting that small pay differences within the studied samples probably understate the true influence of money.
- Company size and prestige barely register. Organization size (+.03) and prestige (−.06) were close to zero. The factors with real weight are ones a 40-person company can influence directly.
Two findings that should change how you act
Averages hide context, and two moderator results are especially practical.
First, rewarding performance changes who leaves. Griffeth and colleagues found that high performers were less likely to quit where rewards were tied to performance (ρ = −.20), but where they were not, the relationship turned slightly positive (+.07). Put simply: if your strongest people are paid the same as everyone else, they are the ones most likely to go.
Second, people compare themselves with the colleagues around them. Rubenstein and colleagues found that dissatisfied employees were even more likely to leave when most of their peers were satisfied. They also found that when many colleagues are thinking about leaving, the usual protective factors such as higher pay, longer tenure and strong performance hold people back less. Departures spread within teams. A cluster of resignations in one department is a reason to act there quickly, not a statistical blip to wait out.
Why the effort pays off
Turnover is not only a recruiting expense. Park and Shaw (2013) pooled 110 independent samples covering more than 120,000 observations and found that higher turnover rates go along with lower organizational performance (ρ = −.15), with the same figure for voluntary turnover. Involuntary turnover showed essentially no relationship (−.01). That supports a point Allen, Bryant and Vardaman (2010) make in their review of common misconceptions: not all turnover is the same, and losing a weak performer is a different event from losing a key one.
Employee retention strategies ranked by the strength of the evidence
The order below follows the research above, weighted by what an employer with 10 to 250 people can realistically change. Each strategy notes what it rests on and where its limits are.
1. Put managers at the center of your retention strategy
Leadership (−.24), climate (−.24), perceived support (−.19), fairness (−.17) and the daily design of work all reach employees through their direct supervisor. In a small company, that supervisor is often the owner. Allen, Bryant and Vardaman counter the belief that managers have little say over turnover and point to training, rewards and supervisory practices as levers that work.
- Hold one-on-ones every two to four weeks that cover workload, development and obstacles, not only task status.
- Promote people into management for their ability to lead, and train new managers in feedback, fair scheduling and difficult conversations before they need those skills.
- Track voluntary and regretted turnover by team and make it part of how managers are evaluated.
2. Fix the job itself: workload, clarity and autonomy
Job characteristics such as variety, autonomy and feedback were linked to lower turnover (−.18). Role ambiguity (+.15), role conflict (+.15), stress and exhaustion (+.21) and work-life conflict (+.19) were linked to higher turnover, and the stress effect is larger in recent studies than in older ones. Older experimental evidence points the same way: in a 1985 meta-analysis, McEvoy and Cascio concluded that job enrichment was about twice as effective at reducing turnover as realistic job previews.
- Write down what each role is responsible for and what it is not. Role ambiguity is one of the cheapest problems to fix.
- Review overtime and after-hours work by team. Chronic overload in one group is a turnover risk you can see months ahead.
- Give people more control over how they do their work, even where the what is fixed.
3. Build visible growth paths and rewards beyond base pay
The category Rubenstein and colleagues call rewards offered, which bundles benefits, career and growth opportunities and training time, came in at −.28, on par with job satisfaction. Promotional chances showed a smaller but consistent effect in the earlier meta-analysis (−.12). Small employers often assume they cannot compete here because they have few promotion slots. Growth does not have to mean a new title. Broader responsibility, a skills-based pay step, support for a certification or a stretch project all count, as long as the path is written down and people can see colleagues moving along it.
4. Pay fairly, explain how, and differentiate for performance
Pay level (−.17) and justice (−.17) carry similar weight, and how pay is decided may matter as much as the amount. Griffeth and colleagues argued that fair procedures tell employees that the employer values them, which builds commitment. Together with the reward finding above, three rules follow:
- Benchmark pay against the local market at least once a year, starting with the roles people leave first.
- Write down how pay decisions are made and share that logic with employees.
- Make sure top performers can see a difference in pay or bonus. Identical raises feel fair to average performers and unfair to the best ones.
5. Offer flexibility where the work allows it
The strongest causal evidence for any single retention practice comes from a randomized trial. Nicholas Bloom, Ruobing Han and James Liang (2024, in Nature) randomly assigned 1,612 graduate employees in engineering, marketing, accounting and finance at Trip.com either to five days in the office or to a hybrid schedule with two days at home, for six months in 2021 and 2022. Quit rates in the hybrid group fell by one-third, from 7.2 to 4.8 percent, job satisfaction rose and performance did not suffer. The drop was largest among non-managers, women and employees with long commutes.
The limits matter. The trial ran at one company’s Shanghai office with university-educated staff. It says nothing about frontline, shift or customer-facing work. In those jobs, flexibility usually means predictable schedules, easy shift swaps and a say in hours, which addresses the same underlying problem of work-life conflict.
6. Treat onboarding as part of retention
The first months test whether person and job actually fit. In a meta-analysis of 70 samples, Talya Bauer and colleagues (2007) found that onboarding practices and newcomers’ own information seeking work through three signs of adjustment: role clarity, self-efficacy (confidence in doing the job) and social acceptance. These in turn relate to satisfaction, commitment, intentions to remain and turnover. A 2025 update by the same group, built on 183 studies, underlined the importance of social acceptance and identified perceived fit as an important but under-studied indicator.
Realistic job previews help too, if modestly. Earnest, Allen and Landis (2011) analyzed 52 studies with roughly 17,000 participants and concluded that previews reduce turnover mainly by making the employer look honest. Their results point to an oral or written preview delivered shortly after hire as the most effective format. Retention therefore starts with what you promise in recruiting, a link we explore in how a credible employer signal helps you attract talent in the U.S.
- Plan the first 90 days with fixed check-ins, for example after the first week, the first month and the third month.
- Assign a peer contact who is not the new hire’s manager, so social acceptance does not hinge on a single relationship.
- Tell new hires plainly what is hard about the job. Candor earns a kind of trust no welcome package can.
7. Strengthen links, fit and what people would give up
Job embeddedness (−.26) is one of the more useful ideas for small employers because it can be built on purpose. Research summaries list teams and committees, informal gatherings, good opportunities and benefits, a close match between a person’s skills and the job, and flexible scheduling as ways to raise it. In practice:
- Links: cross-training, mentoring and project groups that span departments, so no one’s connections run through a single colleague.
- Fit: regular conversations about which parts of the role suit a person and which could be adjusted.
- Sacrifice: benefits and development that build over time, so staying has visible value.
8. Listen early and act on what you hear
Because thoughts of quitting (+.56) and job search (+.40) are the strongest predictors, the most valuable retention tool is any reliable way to hear about them before a resignation letter. Three methods are common.
- Anonymous employee surveys can track commitment, satisfaction, leadership and workload over time. Report results only for groups large enough to protect anonymity, and tell employees what you changed afterward. Our overview of the Top Employer employee survey shows how one published questionnaire is structured.
- Stay interviews are structured conversations with current employees about what keeps them and what might make them leave. They are widely recommended in practice, but we found no controlled study measuring their effect on turnover. Their logic rests on the strong link between withdrawal thoughts and quitting. They work only if managers are trained and follow-up promises are kept.
- Exit interviews come too late for the person leaving but reveal patterns, especially if someone other than the departing employee’s manager conducts them.
What to be careful with
Retention bonuses and repayment clauses
Paying people to stay through a critical stretch, such as a sale of the business or a major project, can make sense. Tying bonuses or training costs to repayment when someone leaves has become riskier. In California, Assembly Bill 692 took effect on January 1, 2026. It prohibits most so-called stay-or-pay provisions in agreements entered into on or after that date, with narrow exceptions, including certain discretionary payments at the start of employment such as sign-on bonuses. According to an analysis by the law firm Proskauer, workers can seek the greater of actual damages or $5,000 in penalties, plus attorney’s fees. Mayer Brown points out that mid-employment retention bonuses with clawback terms are not expressly exempt. California is not the only state legislating in this area, so have counsel review any repayment terms before using them. This article is not legal advice.
Perks that leave the work untouched
None of the top-ranked factors in the research is about office snacks or one-off events. Perks that leave workload, supervision, fairness and growth unchanged are unlikely to move retention much on their own. That is our reading of the evidence rather than a tested result, but it is a useful filter when budgets are tight.
Treating every departure as a failure
A healthy organization will always lose some people, including some it is glad to see go. Track regretted turnover separately, so energy goes to the departures that hurt.
A decision table for employers with 10 to 250 employees
Smaller organizations rarely have the HR staff to run every program at once. Start with the pattern your own data show. If you are new to structured HR assessment, our guide for small businesses covers how companies of this size approach it.
| If your data show | Likely driver (evidence) | First move | Metric to watch |
|---|---|---|---|
| Many people leave within six months of hire | Weak adjustment, unmet expectations (Bauer et al. 2007; Earnest et al. 2011) | 90-day onboarding plan, peer contact, candid preview after hire | Share of hires still employed after 6 and 12 months |
| Departures cluster under one or two managers | Leadership (−.24), climate (−.24) | Coaching, a fixed one-on-one rhythm, a review of the manager’s role | Voluntary turnover by team |
| Your best performers are the ones leaving | No link between performance and rewards (Griffeth et al. 2000) | Differentiate raises and bonuses, define a growth path | Regretted turnover rate |
| Exit reasons mention hours or burnout | Stress (+.21), work-life conflict (+.19) | Workload review, scheduling flexibility | Overtime hours, workload items in your survey |
| People say they are leaving for more money | Pay level (−.17), justice (−.17) | Market benchmark, written pay rules | Quits in the six months after a pay review |
| Long-tenured staff see nowhere to go | Rewards offered (−.28), promotional chances (−.12) | Written career paths, skills-based pay steps | Internal moves per year |
| Several people quit from one team in a short time | Turnover contagion (Rubenstein et al. 2018) | Stay conversations in that team within two weeks | Further quits in the next three months |
How to measure whether your retention strategy works
Four numbers cover most needs:
- Monthly quits rate = voluntary departures in the month ÷ employees on payroll × 100. This mirrors the BLS definition and lets you compare yourself with JOLTS figures for your industry and size class.
- Annual voluntary turnover rate = voluntary departures over 12 months ÷ average headcount × 100.
- First-year attrition = hires from a given period who left within 12 months ÷ all hires from that period × 100.
- Regretted turnover rate = voluntary departures you would have tried to prevent ÷ average headcount × 100.
Worked example. A company with 60 employees had 15 voluntary departures over the past 12 months, an annual voluntary turnover rate of 25 percent. Suppose the people who left earned $55,000 a year on average. Boushey and Glynn’s 2012 review of turnover cost studies found a median cost of 21 percent of annual salary across 27 case studies, excluding executives and physicians. On that basis, each departure cost about $11,550, or roughly $173,000 for the year. For positions paying up to $75,000, most estimates in the review fell between 10 and 30 percent of salary, which puts the realistic range at about $82,500 to $247,500. Preventing five of those departures would save around $58,000 at the median estimate, before counting any effect on team performance. The review drew on studies published between 1992 and 2007, so treat these figures as a starting point and replace them with your own recruiting, overtime and ramp-up costs where you can.
Some external assessments structure part of this measurement for you. The Top Employer methodology, developed by PhDr. Oliver Scharfenberg, combines an employee survey with seven dimensions, among them “Your manager” and “Satisfaction & loyalty”, with an HR assessment of 39 criteria that includes an area on transitions and separations. Results are only shown for groups of at least five responses, and the full criteria are published on usiq.org. A certificate does not guarantee lower turnover, but the aggregate results show where employees rate their workplace weakest. What the process involves is laid out in our step-by-step guide to becoming a Top Employer.
Limits of the evidence and open questions
- Most findings are correlational. Meta-analyses show which factors travel with turnover, not that changing them will cause fewer quits. Randomized trials such as the Trip.com study are rare.
- Effects vary a lot by setting. For most predictors in the Rubenstein meta-analysis, heterogeneity was high, meaning the size of an effect differs between organizations and populations. Your own data should decide priorities.
- Small employers are underrepresented. The average sample in that meta-analysis had more than 1,000 employees, and healthcare, banking and the military were heavily represented. Findings from companies with 20 or 80 staff are scarce.
- Popular tools lack outcome studies. We did not find controlled studies showing that stay interviews or recognition platforms reduce actual turnover. They may help; the evidence just is not there yet.
- Labor statistics have their own limits. JOLTS size classes describe establishments, not firms, and monthly figures are revised as more reports come in.
A 90-day retention plan
Days 1 to 30: diagnose
- Calculate voluntary, regretted and first-year turnover for the past 24 months, by team and role.
- Compare your monthly quits rate with the JOLTS rate for your industry and size class.
- Review exit reasons and look for clusters by manager, shift or tenure.
Days 31 to 60: act on the biggest gap
- Pick one or two drivers from the decision table, not seven.
- Start a fixed one-on-one rhythm for every manager and a 90-day onboarding plan for every new hire.
- Benchmark pay for the two roles with the highest turnover and write down how pay decisions are made.
Days 61 to 90: listen and adjust
- Run a short anonymous pulse survey on workload, leadership and intentions to stay.
- Hold stay conversations in teams with recent departures.
- Set quarterly targets for the four metrics above and review them with your managers.
Sources
- Allen, D. G., Bryant, P. C., & Vardaman, J. M. (2010). Retaining talent: Replacing misconceptions with evidence-based strategies. Academy of Management Perspectives, 24(2), 48–64. doi.org/10.5465/AMP.2010.51827775
- Bauer, T. N., Bodner, T., Erdogan, B., Truxillo, D. M., & Tucker, J. S. (2007). Newcomer adjustment during organizational socialization: A meta-analytic review of antecedents, outcomes, and methods. Journal of Applied Psychology, 92(3), 707–721. doi.org/10.1037/0021-9010.92.3.707
- Bauer, T. N., Erdogan, B., Ellis, A. M., Truxillo, D. M., Brady, G. M., & Bodner, T. (2025). New horizons for newcomer organizational socialization: A review, meta-analysis, and future research directions. Journal of Management, 51(1), 344–382. ore.exeter.ac.uk
- Bloom, N., Han, R., & Liang, J. (2024). Hybrid working from home improves retention without damaging performance. Nature, 630, 920–925. pmc.ncbi.nlm.nih.gov/articles/PMC11208135
- Boushey, H., & Glynn, S. J. (2012). There are significant business costs to replacing employees. Center for American Progress. americanprogress.org
- Bureau of Labor Statistics (2026). Job Openings and Labor Turnover – September 2026 (USDL-26-1630), released November 3, 2026. bls.gov
- Earnest, D. R., Allen, D. G., & Landis, R. S. (2011). Mechanisms linking realistic job previews with turnover: A meta-analytic path analysis. Personnel Psychology, 64(4), 865–897. doi.org/10.1111/j.1744-6570.2011.01230.x
- Griffeth, R. W., Hom, P. W., & Gaertner, S. (2000). A meta-analysis of antecedents and correlates of employee turnover: Update, moderator tests, and research implications for the next millennium. Journal of Management, 26(3), 463–488. doi.org/10.1177/014920630002600305
- Mayer Brown (2026). A deeper dive into California’s new limitations on “stay or pay” clauses as of January 1, 2026. mayerbrown.com
- McEvoy, G. M., & Cascio, W. F. (1985). Strategies for reducing employee turnover: A meta-analysis. Journal of Applied Psychology, 70(2), 342–353. digitalcommons.usu.edu
- Mitchell, T. R., Holtom, B. C., Lee, T. W., Sablynski, C. J., & Erez, M. (2001). Why people stay: Using job embeddedness to predict voluntary turnover. Academy of Management Journal, 44(6), 1102–1121. doi.org/10.5465/3069391
- Park, T.-Y., & Shaw, J. D. (2013). Turnover rates and organizational performance: A meta-analysis. Journal of Applied Psychology, 98(2), 268–309. doi.org/10.1037/a0030723
- Proskauer (2026). New restrictions on California’s “stay-or-pay” provisions require employers to review repayment agreements. calemploymentlawupdate.proskauer.com
- Quality Improvement Center for Workforce Development (2020). Umbrella summary: Job embeddedness. qic-wd.org
- Rubenstein, A. L., Eberly, M. B., Lee, T. W., & Mitchell, T. R. (2018). Surveying the forest: A meta-analysis, moderator investigation, and future-oriented discussion of the antecedents of voluntary employee turnover. Personnel Psychology, 71(1), 23–65. doi.org/10.1111/peps.12226
Frequently asked questions
What are the most effective employee retention strategies?
Based on the largest meta-analysis of turnover research, the strongest levers are the quality of leadership and climate, fit between people and their jobs, growth opportunities and benefits beyond base pay, manageable workloads and fair pay processes. Flexible work has the strongest causal evidence from a randomized trial, at least for office-based roles. Which of these comes first depends on where your own departures cluster.
How do I calculate my employee turnover rate?
Divide the number of voluntary departures over 12 months by your average headcount for the same period and multiply by 100. For a monthly figure comparable with BLS data, divide voluntary departures in a month by the number of employees on payroll. Track regretted departures and first-year attrition separately, since they point to different causes.
Does higher pay reduce employee turnover?
Yes, but less than most managers assume. In the 2018 meta-analysis, pay level was linked to turnover at ρ = −.17, weaker than leadership, fit or rewards beyond base pay. How pay is decided and whether top performers are rewarded differently appear to matter at least as much as the amount.
Are stay interviews worth doing?
They can be, as a way to hear about dissatisfaction and job search early, which are the strongest predictors of quitting. We found no controlled studies on their effect on turnover, so treat them as a listening tool that only works when managers are trained and act on what they hear.
How can a small business compete with large employers on retention?
Organization size has almost no relationship with individual turnover in the research. The factors that matter most, such as supervision, fit, fairness, workload and visible growth, are often easier to improve in a company of 50 than in one of 5,000, because leaders are closer to every team.

Next step
Show Candidates What Your Team Says
Top Employer (USIQ) combines a confidential employee survey with an HR assessment against 39 published criteria. One-time packages start at $2,990.
How to write engagement survey questions that hold up: what engagement means, how to word items, how many responses small teams need, U.S. legal guardrails and what to do with the results.

Where a Top Employer seal works hardest in recruiting, how to describe it accurately and which wording to avoid once your company is certified.

Six practical steps from “we think we are a good place to work” to a seal your candidates can check, and why most of the work happens before you apply.