
Search for employee engagement survey questions and you will find lists of 25, 50 or 100 items, ready to copy. Most of them are fine sentences. The trouble is that a list of sentences is not yet a measurement. Nobody tells you which questions measure engagement itself and which measure the conditions that create it, how many answer options to offer, whether to mix in reverse-worded items, how many responses a team needs before a result means anything, or what to do once the numbers arrive.
This guide fills those gaps. It is written for HR leaders and owners of U.S. companies with roughly 10 to 250 employees, where a handful of answers can swing a score and where there is rarely a people-analytics team to clean up a badly designed questionnaire. You will find the research behind the construct, practical rules for writing items, a question bank written from scratch, a precision table for small companies, the U.S. legal guardrails worth knowing, and a simple process for turning results into action.
Why most lists of engagement questions fall short
The pages that rank for this topic share a pattern. They group questions into categories such as culture, manager, growth and recognition, recommend a five-point agreement scale, add an eNPS item and close with a reminder to act on the results. That is a reasonable starting point. What they leave out is the part that decides whether the data can be trusted.
Three gaps stand out. First, almost none define what “engagement” means, so outcome questions (“I am enthusiastic about my job”) sit next to condition questions (“I have the tools I need”) as if they measured the same thing. Second, design advice is given without evidence, and some of it is contradicted by research. A common tip, for example, is to add a reverse-worded item to each section to catch careless answers; the evidence suggests this tends to confuse respondents rather than protect the data. Third, small employers get no help with the arithmetic. A score from 9 people out of 12 behaves very differently from a score from 900 out of 1,200.
What “employee engagement” actually means
Before writing a single question, decide what you are trying to measure. Research offers two definitions that most serious instruments build on.
Kahn: bringing yourself to the work
William Kahn’s 1990 study in the Academy of Management Journal is the usual starting point. Based on interviews with summer camp counselors and staff at an architecture firm, Kahn described personal engagement as people employing and expressing themselves physically, cognitively and emotionally in their work roles. He identified three psychological conditions behind it: meaningfulness (the sense that investing yourself in the role pays off), safety (feeling able to show yourself without fear of damage to your image, status or career) and availability (having the physical, emotional and psychological resources to engage at that moment).
Kahn’s framework is useful for survey design because it points to causes. If people feel unsafe speaking up or are too drained to invest themselves, asking them to rate their enthusiasm will tell you something is wrong, but not what.
Schaufeli and colleagues: vigor, dedication and absorption
The second line of research comes from Wilmar Schaufeli and colleagues, who defined work engagement in 2002 as a positive, fulfilling, work-related state of mind characterized by vigor, dedication and absorption. Their Utrecht Work Engagement Scale (UWES) became the most widely used research measure. The original version had 17 items; a nine-item short form followed in 2006, and in 2019 the team validated a three-item version across five national samples, reporting that it shared 86 to 92 percent of its variance with the nine-item form.
One practical point that question lists rarely mention: according to the copyright notice on the authors’ own forms, the UWES is free for non-commercial scientific research, while commercial or non-scientific use requires prior written permission from the authors. If you want to use it in a company survey, ask first.
Engagement is not the same as satisfaction
It is tempting to treat engagement as a fashionable word for job satisfaction. The evidence says they overlap but are not identical. In a meta-analysis of 91 studies published in Personnel Psychology, Michael Christian, Adela Garza and Jerel Slaughter (2011) found corrected correlations between engagement and job satisfaction of .53, organizational commitment of .59 and job involvement of .52. Those are substantial relationships, yet clearly below 1.0, which the authors read as evidence that engagement is a distinct construct.
Macey and Schneider (2008) made a related point in Industrial and Organizational Psychology: the term had been used for psychological states, traits and behaviors, often loosely. Christian and colleagues also noted that some widely used “engagement” surveys mostly ask about work conditions such as resources, feedback and development rather than about the experience of the work itself. That is not wrong. It simply means those surveys measure drivers, and you should know which kind of question you are asking.
The two-layer model: outcome items and driver items
The most useful design principle for any employee engagement questionnaire follows directly from that distinction. A good engagement survey has two layers.
The outcome layer is a short index of three to five items that captures engagement itself: energy, dedication, absorption, and often a closely related outcome such as intention to stay. You track this index over time and use it to see whether things are getting better or worse.
The driver layer covers the conditions you can change: clarity of expectations, resources, the relationship with the direct manager, voice and psychological safety, growth, recognition and fairness, workload. These items tell you where to act. When the outcome index drops, you look at which drivers moved with it.
A third, smaller layer adds two or three open questions, and a fourth collects only the demographic information you truly need for reporting. Keeping these layers separate prevents the most common analysis mistake: averaging everything into one “engagement score” that no manager can do anything with.
What the evidence says about engagement and performance
Why measure engagement at all? Because it is linked to outcomes employers care about, although the links are less dramatic than vendor marketing often suggests.
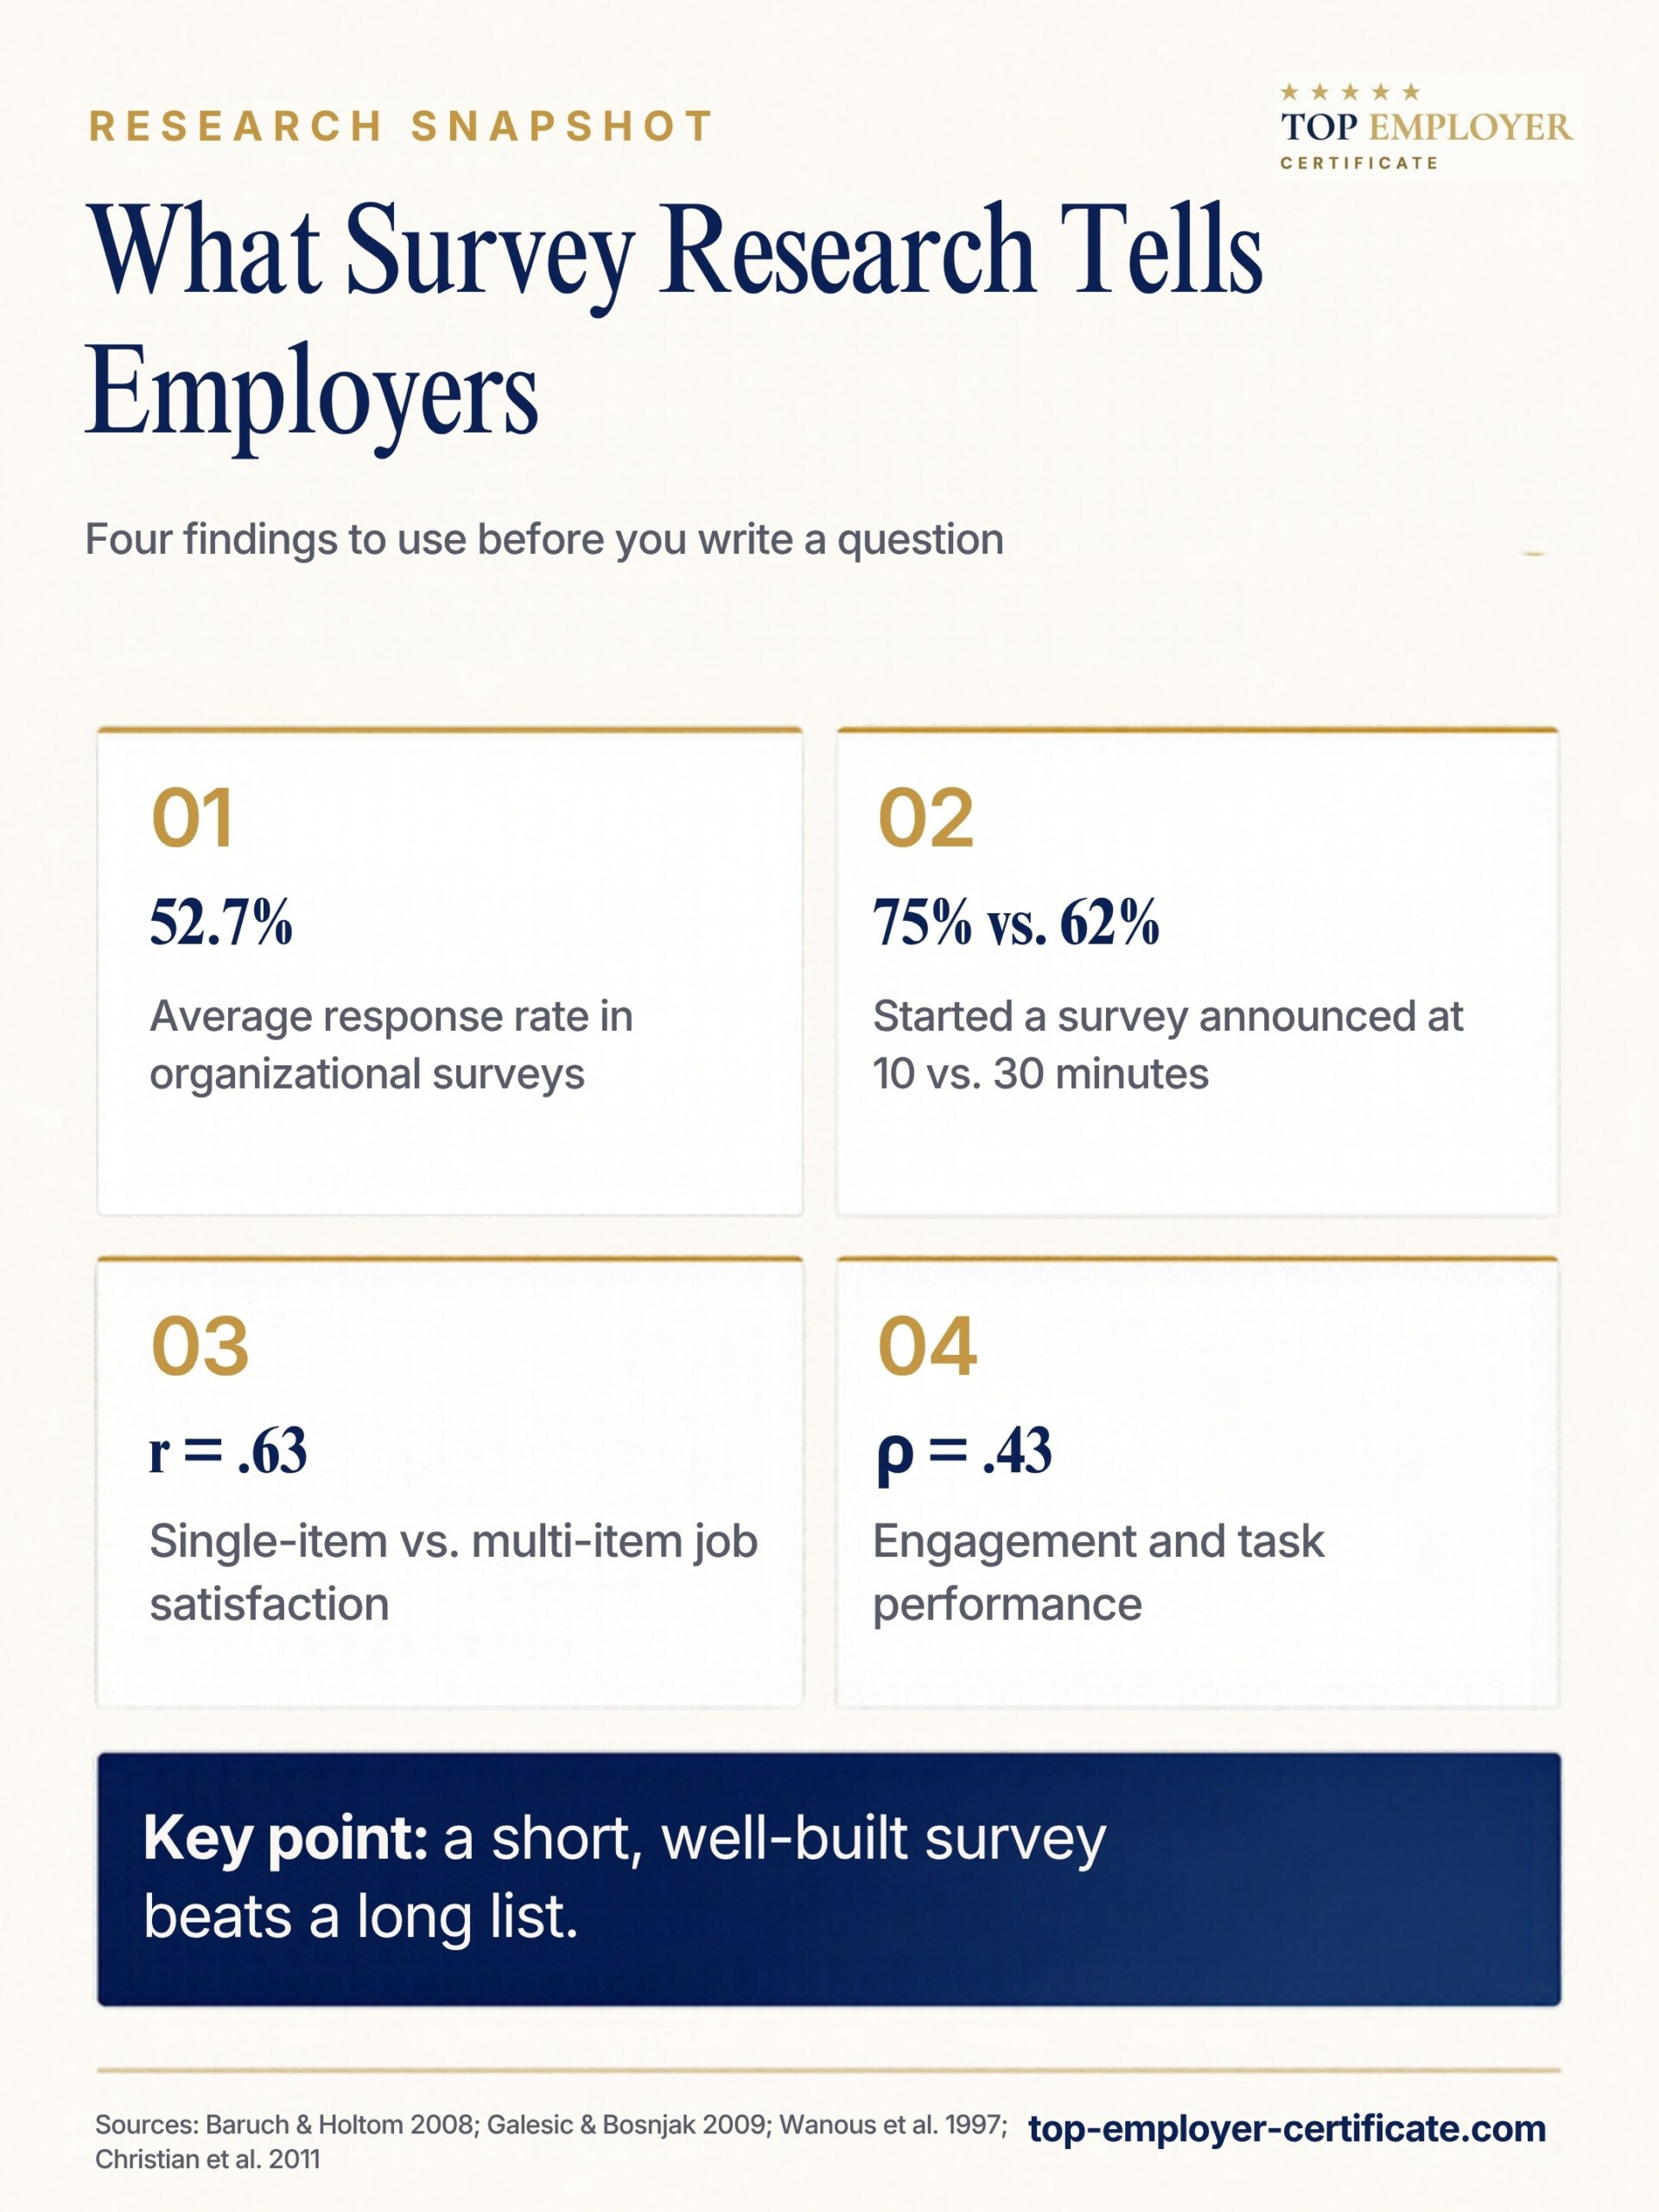
At the individual level, Christian, Garza and Slaughter (2011) found corrected correlations of .43 between engagement and task performance and .34 between engagement and contextual performance, the helpful extra-role behavior that keeps teams running. Engagement also predicted performance beyond satisfaction, commitment and involvement. The authors were candid about limits: most studies in their data set were cross-sectional and relied on self-reports, so causal direction could not be settled.
At the business-unit level, Harter, Schmidt and Hayes (2002) analyzed 7,939 business units in 36 companies in the Journal of Applied Psychology and found generalizable relationships between unit-level satisfaction and engagement scores and customer satisfaction, productivity, profit, employee turnover and accidents. Two caveats apply. The study was based on one survey instrument developed by the lead author’s employer, and correlation across units does not prove that raising scores will raise profit.
For a small employer the takeaway is modest and practical: engagement is worth tracking because it tends to travel with performance and retention, but the value of a survey lies in finding fixable problems, not in producing a number that is supposed to predict revenue. If retention is your main concern, our guide to employee retention strategies ranked by the evidence shows which levers have the strongest research behind them.
How to write questions that measure what you intend
Item writing is where most surveys lose their quality. The following rules are based on survey methodology research rather than habit.
Ask about one thing at a time
“My manager gives me clear goals and regular feedback” is two questions. Someone who gets clear goals but no feedback has no correct answer. Split every item that contains “and” or “or” unless both parts are truly the same idea. Also prefer concrete behavior over global judgments: “My manager follows through on what they say they will do” is easier to answer honestly than “My manager is a good leader.”
Consider item-specific answer options
Agree/disagree scales are popular because one scale fits every statement. They also invite acquiescence, the tendency to agree regardless of content. Saris, Revilla, Krosnick and Shaeffer (2010) compared the two formats in experiments embedded in the European Social Survey and found that responses to agree/disagree questions were of considerably lower quality than responses to questions whose answer options matched the content of the question. Instead of “I have enough time to do my job well: strongly agree to strongly disagree”, ask “How often do you have enough time to do your job well?” with options from “never” to “always”.
You do not have to rewrite every item. Agreement scales are practical for long batteries and keep trend data comparable. But for questions about frequency, quantity or intensity, an item-specific scale is the better choice.
Skip the reverse-worded “trap” items
Several popular guides recommend sprinkling negatively phrased items into each section to catch people who click the same answer all the way down. Van Sonderen, Sanderman and Coyne (2013) tested this logic with data from 700 respondents in PLoS ONE. Reverse-worded items did not prevent inattentive or acquiescent answering. Instead, the data suggested that scores were contaminated by inattention and confusion, and fewer mistakes were made with items all worded in the same direction. If you want to detect careless responding, look at completion times and identical answer patterns after the fact rather than building confusion into the questionnaire.
Choose the number of answer options deliberately
Preston and Colman (2000) compared rating scales with 2 to 11 response categories. Scales with two, three or four categories performed relatively poorly on reliability, validity and discriminating power; indices improved as categories increased up to about seven, and test-retest reliability tended to fall for scales with more than ten categories. Five to seven points is therefore a sensible range.
Whether to offer a neutral midpoint is a design choice with trade-offs. A midpoint lets people with no clear view say so; leaving it out forces a lean in one direction. The Top Employer certification survey, for example, uses a six-point agreement scale without a midpoint and normalizes each answer to a 0 to 1 value for scoring. Whatever you choose, keep it identical across survey waves, or year-on-year comparisons become meaningless.
Use several items for the outcome, single items for simple facts
Psychologists generally prefer multi-item scales because random error averages out across items. Single items are not useless, though. Wanous, Reichers and Hudy (1997) meta-analyzed 28 correlations from 17 studies with 7,682 people and found that single-item measures of overall job satisfaction correlated .63 with multi-item scales on average. That is good enough for a simple global question, not good enough to carry a complex construct like engagement on its own.
Internal consistency, usually reported as Cronbach’s alpha, rises with the number of items. Cortina (1993) showed in the Journal of Applied Psychology that alpha depends heavily on test length, so a high alpha from a long scale is not proof of a coherent construct. The table below illustrates the effect with a standard formula, assuming every pair of items correlates at .30.
| Number of items | Expected alpha (average inter-item r = .30) |
|---|---|
| 3 | .56 |
| 5 | .68 |
| 8 | .77 |
| 12 | .84 |
Own calculation using the standardized alpha formula k·r / (1 + (k−1)·r). Real items usually correlate more strongly within a well-defined scale, which is why validated three-item engagement measures can still reach acceptable reliability.
The practical rule: give the outcome index three to five items that clearly belong together, and check alpha once you have data. Values well below .70 suggest that one item is measuring something else.
A sample question bank, written from scratch
The items below were written for this guide and are not taken from any published instrument. They follow the two-layer model. Treat them as a starting point: pilot them with a few employees, drop what confuses people and check how the outcome items hang together once you have responses.
Outcome index (engagement and intention to stay)
- Most days, I start work with real energy for what is ahead.
- The work I do here feels worthwhile to me.
- When I am working, I am usually fully focused on the task in front of me.
- When I describe my job to people outside work, I do it with some pride.
- I expect to still be working here a year from now.
Driver items
| Driver | Example item | A low score often points to |
|---|---|---|
| Meaning | I can see how my work affects customers or colleagues. | Roles cut off from results; little feedback from the people served |
| Clarity | I know what a good week of work looks like in my role. | Vague goals, shifting priorities, missing job descriptions |
| Resources | I have the tools and information I need to finish my work without workarounds. | Outdated systems, slow approvals, knowledge held by one person |
| Manager | My manager gives me feedback I can act on. | Infrequent one-on-ones, untrained first-line managers |
| Manager | My manager follows through on what they say they will do. | Overloaded managers, broken promises after earlier surveys |
| Voice and safety | I can raise a problem here without worrying about how it will reflect on me. | Blame culture, negative reactions to past criticism |
| Voice and safety | When people suggest improvements, something usually happens with their ideas. | Suggestions disappear; no visible follow-up |
| Growth | In the last six months I have learned something that makes me better at my job. | No training budget or time, repetitive work |
| Growth | I can see a realistic next step for myself here. | Flat structure without development paths, unclear criteria |
| Recognition | Good work gets noticed here. | Recognition only for visible roles, managers not looking |
| Fairness | Decisions about pay and promotion are explained in a way I understand. | Opaque pay decisions, perceived favoritism |
| Workload | How often can you do your job well within your normal working hours? (never to always) | Understaffing, unrealistic deadlines, unplanned overtime |
| Recovery | After work, I usually have energy left for my life outside the job. | Chronic overload, after-hours messages, shift patterns |
| Team | People on my team help each other when work piles up. | Silos, conflict, unclear responsibilities |
Open questions (use two or three, not more)
- What is one thing we should keep doing, no matter what?
- What gets in the way of doing your best work?
- If you could change one thing about working here next month, what would it be?
Two notes on wording. The recovery item asks about energy after work, not about health; that keeps the survey away from medical territory, which matters for the legal reasons explained below. And the workload item uses a frequency scale, following the item-specific advice above.
How long should the survey be?
Length affects both whether people start and how carefully they answer. In a web-survey experiment, Galesic and Bosnjak (2009) told potential respondents that the questionnaire would take 10, 20 or 30 minutes. Seventy-five percent started the 10-minute version, compared with 65 percent for 20 minutes and 62 percent for 30 minutes. Answers to questions placed later in the longer versions also tended to be faster and more uniform.
For most small and midsize employers, 20 to 30 closed items plus two or three open questions is a sensible ceiling for an annual survey; that typically fits within ten minutes. For comparison, the Top Employer employee survey has 46 questions, 32 of them scored, and is designed to take about 8 to 10 minutes. Short pulse surveys between annual waves can repeat the outcome index plus a few driver items you are actively working on.
Anonymity, confidentiality and minimum group sizes
People answer questions about their manager honestly only if they believe nobody can trace the answer back to them. Two terms are often confused. A survey is anonymous when no one, including the survey provider, can link responses to individuals. It is confidential when someone could technically link them but has committed not to and limits reports accordingly. Tell employees which one applies; overpromising anonymity and then showing team-level results that identify people destroys trust for years.
The more important rule for small companies is a minimum reporting group. A common threshold is five valid responses: no average, percentage or comment summary is shown for any group smaller than that. The Top Employer methodology applies exactly this rule, dropping items with fewer than five valid answers and never displaying a subgroup result below five responses. In a 30-person company, this usually means reporting by department only if each department has enough respondents, and almost never crossing two demographic variables. “Women in sales with less than two years of tenure” can easily be one person.
Collect only the demographics you will actually use in reporting. Every extra field, from age band to shift, makes re-identification easier and makes cautious employees less likely to answer.
Response rates: what is realistic and what matters more
How many people should respond? Benchmarks from academic research give a rough sense. Baruch and Holtom (2008) reviewed surveys in 17 journals and found an average response rate of 52.7 percent for data collected from individuals. A follow-up by Holtom, Baruch, Aguinis and Ballinger (2022) analyzed 1,014 surveys from 2010 to 2020 and found averages rising from 53 percent in 2010 to 68 percent in 2020. Internal employee surveys with visible leadership support often do better, but published averages are the honest reference point.
The rate itself matters less than who is missing. Rogelberg and colleagues (2000) found that employees who indicated they would not comply with a survey request had greater intentions to quit, lower commitment and lower satisfaction with their supervisors and jobs. A later study by Rogelberg and colleagues (2003) separated two groups: active nonrespondents, who deliberately refuse (about 15 percent of the population in their sample) and were less satisfied with the organization sponsoring the survey, and passive nonrespondents, who simply forget or run out of time and were attitudinally similar to respondents. Reminders help with the passive group. The active group only shrinks when people trust that answers are safe and that something will happen afterwards.
Precision in small companies
Small employers face a statistical problem that large companies can ignore. With few respondents, a “percent favorable” figure can move by many points from one year to the next for no real reason. The table and graphic below show the approximate margin of error for a single percent-favorable result, assuming responses are like a random draw from the workforce.
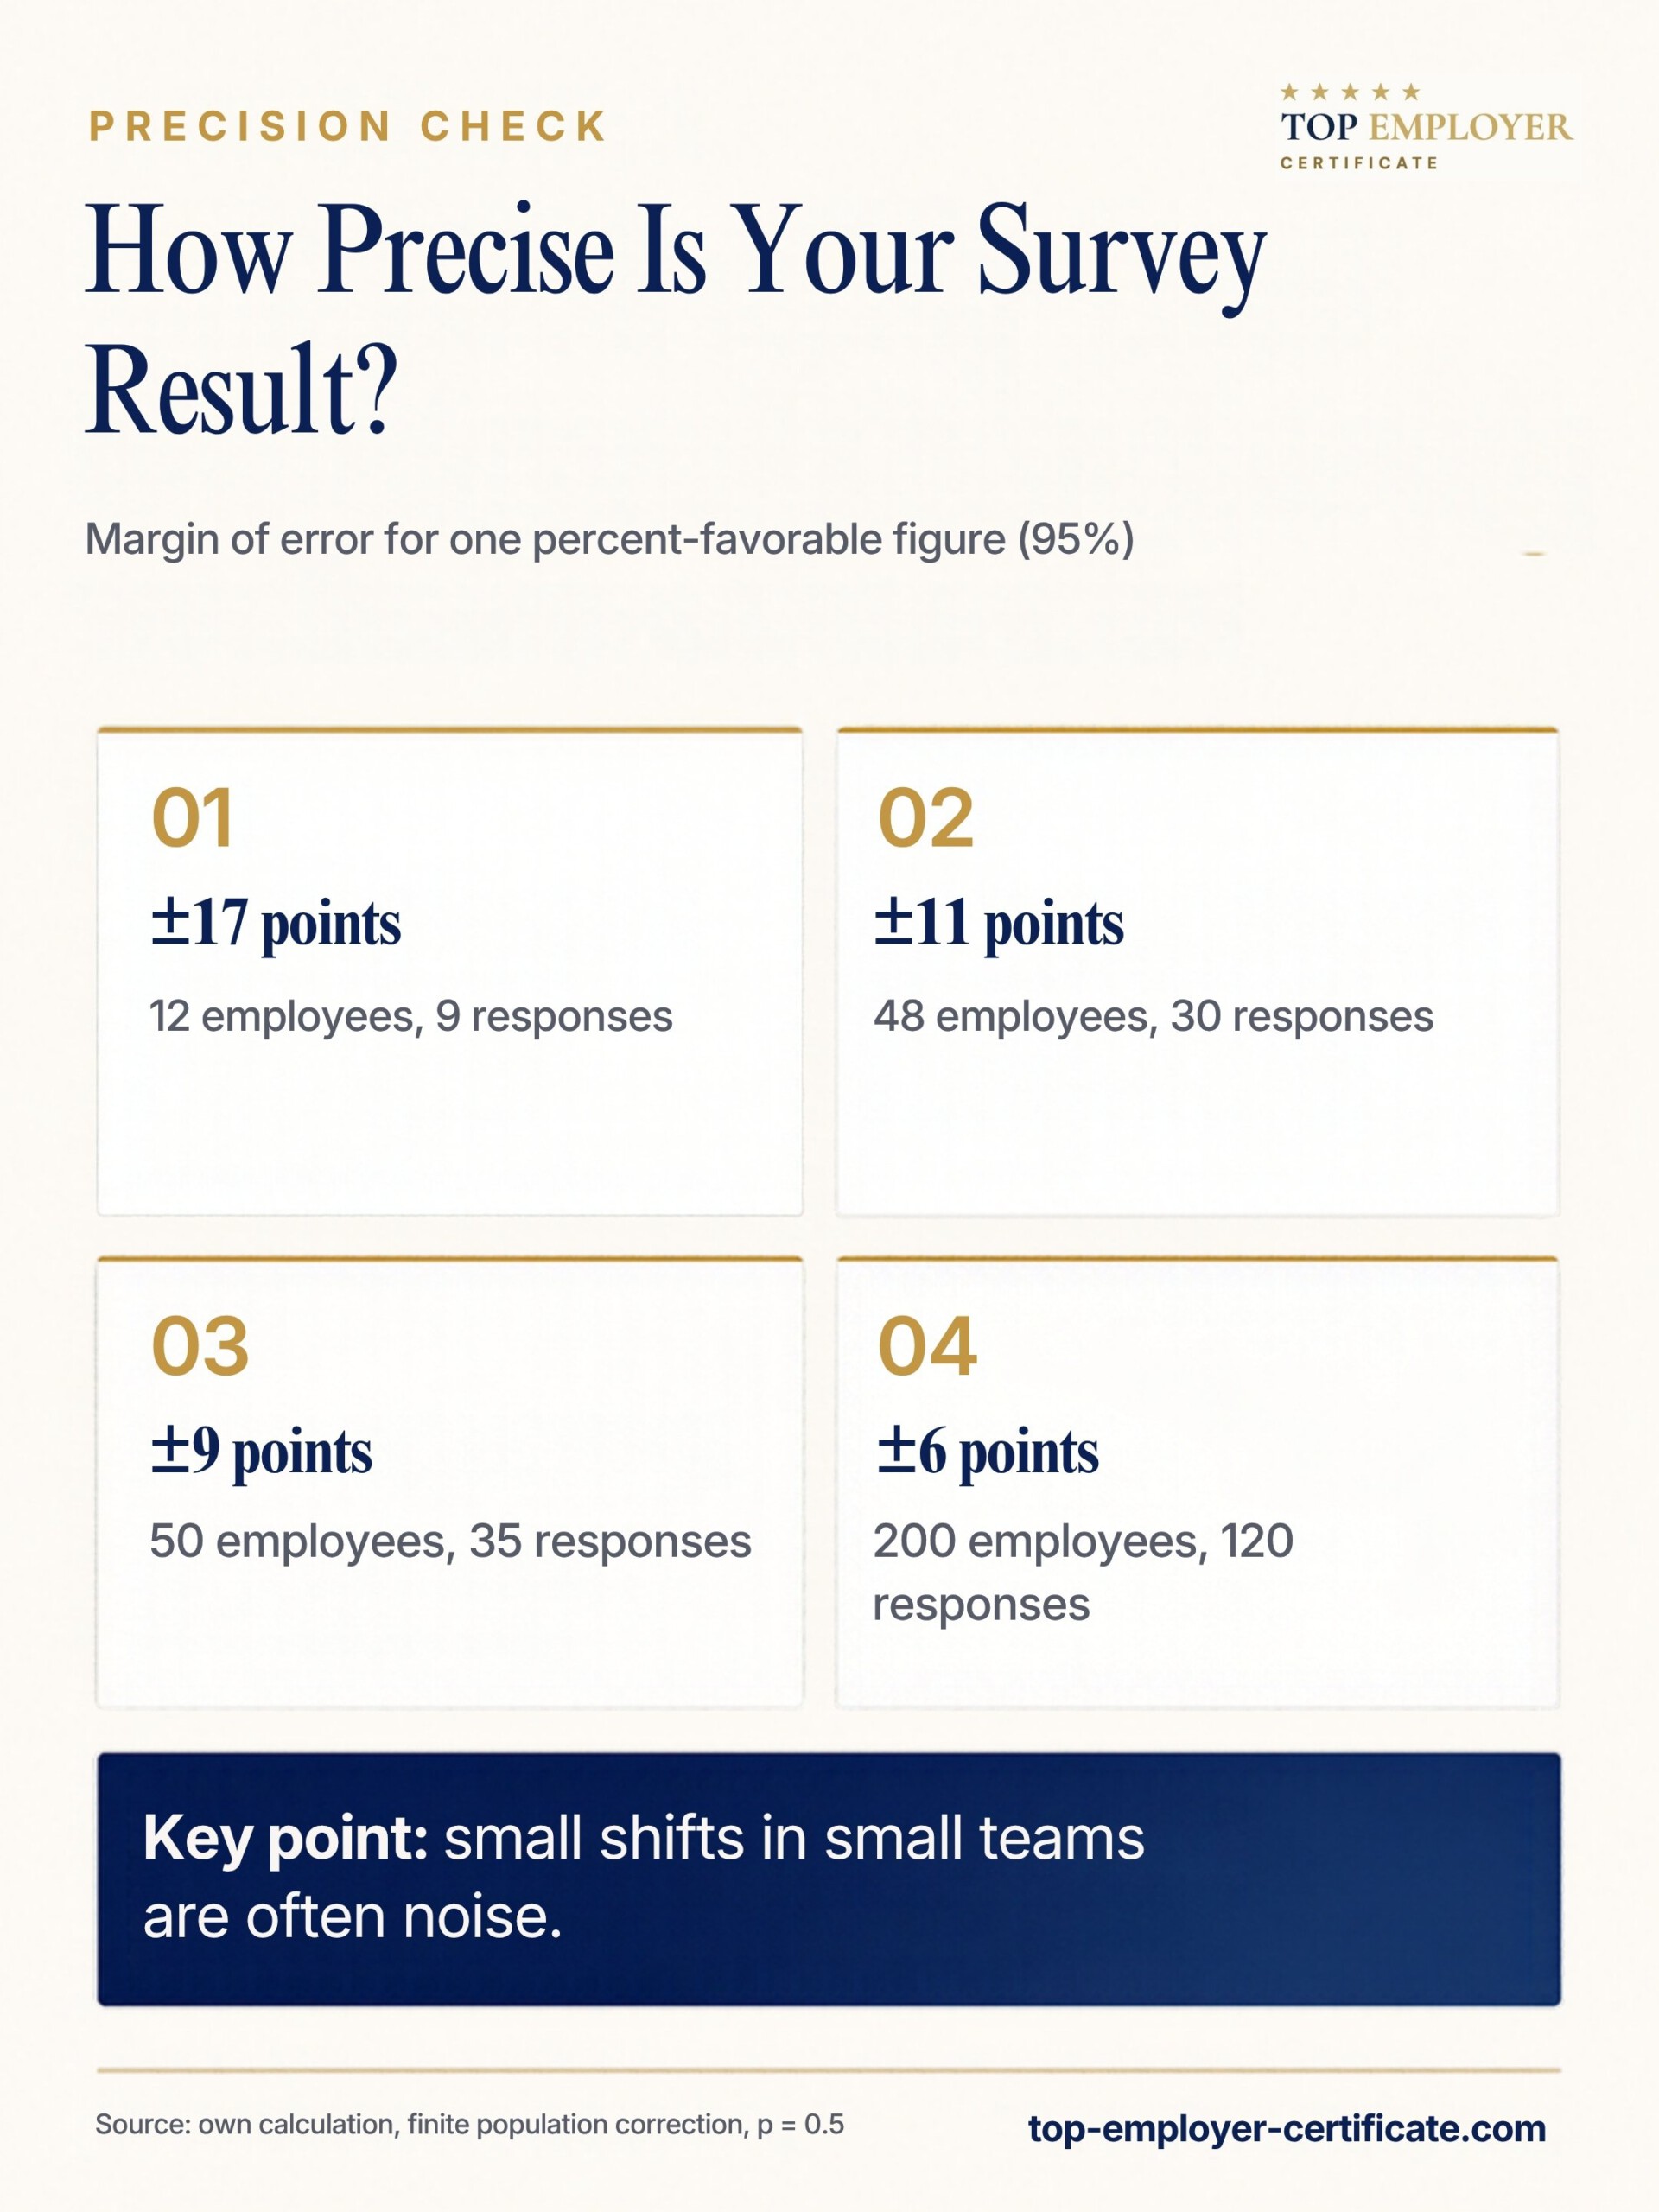
| Employees | Responses | Margin of error (95%, percentage points) |
|---|---|---|
| 12 | 9 | ±17 |
| 48 | 30 | ±11 |
| 50 | 35 | ±9 |
| 200 | 120 | ±6 |
Own calculation: 1.96 × √(p(1−p)/n × (N−n)/(N−1)) with p = 0.5 and finite population correction. If nonrespondents differ systematically from respondents, the true uncertainty is larger.
This is why response-rate minimums are not bureaucracy. The Top Employer certification, for instance, only issues a result when both a minimum rate and a minimum number of responses are reached, for example 50 percent for companies with 10 to 39 U.S. employees and 30 percent for 40 to 249. Whatever survey you run, do not celebrate or panic over a five-point change in a group of 20.
U.S. legal guardrails worth knowing
Engagement surveys are generally lawful and common. Two areas still deserve attention, and this section is general information rather than legal advice.
Labor law and union organizing. Under the National Labor Relations Act, soliciting employee grievances during a union organizing campaign can be treated as an implied promise to fix them, which may be unlawful interference. In Mek Arden, LLC (365 NLRB No. 109, 2017), the Board found a violation after a senior manager asked an employee how things were going during the critical period before an election and replied that he would look into the complaint. Employers who survey on a regular, documented schedule are in a much stronger position than those who launch a first-ever survey when organizing begins. If an organizing campaign is under way, talk to labor counsel before sending any survey.
Disability-related questions. The EEOC’s enforcement guidance under the Americans with Disabilities Act explains that, once someone is employed, disability-related inquiries (questions likely to elicit information about a disability) must be job-related and consistent with business necessity. Well-intended wellbeing items can drift into this territory. Ask about workload, recovery time and support, not about diagnoses, medication or mental health conditions.
Where eNPS fits
Many templates include an employee Net Promoter Score question: “How likely are you to recommend this company as a place to work?” on a 0 to 10 scale. It is easy to track and easy to explain. Be careful about the claims attached to it. The customer version of the metric was tested by Keiningham, Cooil, Andreassen and Aksoy (2007) in the Journal of Marketing with longitudinal data from 21 firms and more than 15,500 interviews; they could not replicate the claimed superiority of Net Promoter over other measures in predicting revenue growth. For employees, the score is a single item, its cut-offs were carried over from the customer metric, and in a small team two or three answers can swing it widely. Use it as one outcome item next to your index, not as the index itself.
From results to action
A survey that leads nowhere does damage. Employees learn that speaking up is pointless, and the active nonrespondent group grows. The research on follow-up is thinner than the research on measurement, but it points in a consistent direction.
Church and colleagues (2012) examined eleven years of survey and action-planning data at a multinational consumer products company and reported more favorable attitudes where results were shared and acted on. Huebner and Zacher (2021) studied 3,091 organizational units of a large German company in the Journal of Personnel Psychology and found that developing action plans can lead to improvements in later survey scores, although the effect sizes were generally small. In a follow-up study, the same authors found that teams tended to choose topics they could address within their own unit and were less likely to plan actions on direct leadership and voice climate, precisely the areas where problems make action planning harder in the first place.
That last finding has a practical consequence: leadership and voice issues often need support from outside the team, such as an HR partner, a senior leader or a facilitator. A workable sequence for a company with 10 to 250 employees looks like this:
- Within two weeks of closing: share headline results with everyone, including the weak spots. Say which group sizes were too small to report.
- Within four weeks: each team discusses its results in a short meeting and picks one or two drivers to work on, not ten.
- Within six weeks: write down each action with an owner, a date and what “done” looks like. Leadership takes on company-wide topics such as pay transparency or tools.
- During the year: report progress at regular intervals (“you said, we did”) and use a short pulse on the chosen drivers.
- Next survey: keep the core items unchanged so you can compare, and check whether the drivers you worked on moved.
If you are building a broader program around the survey, our step-by-step guide to becoming a top employer shows how listening, HR practices and documentation fit together.
Worked example: a 48-person company
Consider a fictional logistics firm with 48 employees in three teams of 22, 18 and 8 people. It runs a 24-item survey with a five-item outcome index, 16 driver items and three open questions. Thirty people respond, a rate of 62.5 percent.
The outcome index comes in at 64 percent favorable, up from 58 percent the year before. With 30 responses, the margin of error for a company-wide figure is roughly ±11 points, so the six-point rise is encouraging but not proof of improvement. The eight-person team returns four responses, so under the five-response rule its results are folded into the company total rather than shown separately.
The driver that stands out is workload: only 40 percent say they can usually do their job well within normal hours, and the comment question repeatedly mentions last-minute route changes. That is a concrete, local problem. The operations lead commits to publishing routes 24 hours in advance and reports back after three months. A year later, the workload item is the first number everyone looks at.
Small companies face particular challenges with surveys and certification; our guide for small businesses covers group sizes and preparation in more detail.
Checklist before you launch
- Have you written down what you mean by engagement and separated outcome items from driver items?
- Does every item ask about one thing, in plain language, about something employees can observe?
- Have you used frequency or quantity scales where they fit the question?
- Have you removed reverse-worded “trap” items?
- Is the answer scale identical to last year’s?
- Does the survey fit within about ten minutes?
- Have you told employees whether the survey is anonymous or confidential, and set a minimum reporting group of at least five?
- Are demographic questions limited to what you will actually report?
- Have you checked items for health or disability content and asked counsel if an organizing campaign is under way?
- Do you know who will share results, by when, and who owns the follow-up?
If you would like your survey and HR practices assessed by an outside party against published criteria, the USIQ Top Employer methodology explains how its employee survey and HR assessment are scored.
Sources
- Baruch, Y., & Holtom, B. C. (2008). Survey response rate levels and trends in organizational research. Human Relations, 61(8), 1139–1160. doi.org/10.1177/0018726708094863
- Christian, M. S., Garza, A. S., & Slaughter, J. E. (2011). Work engagement: A quantitative review and test of its relations with task and contextual performance. Personnel Psychology, 64(1), 89–136. doi.org/10.1111/j.1744-6570.2010.01203.x
- Church, A. H., Golay, L. M., Rotolo, C. T., Tuller, M. D., Shull, A. C., & Desrosiers, E. I. (2012). Without effort there can be no change: Reexamining the impact of survey feedback and action planning on employee attitudes. Research in Organizational Change and Development, 20, 223–264. doi.org/10.1108/S0897-3016(2012)0000020010
- Cortina, J. M. (1993). What is coefficient alpha? An examination of theory and applications. Journal of Applied Psychology, 78(1), 98–104. doi.org/10.1037/0021-9010.78.1.98
- Galesic, M., & Bosnjak, M. (2009). Effects of questionnaire length on participation and indicators of response quality in a web survey. Public Opinion Quarterly, 73(2), 349–360. doi.org/10.1093/poq/nfp031
- Harter, J. K., Schmidt, F. L., & Hayes, T. L. (2002). Business-unit-level relationship between employee satisfaction, employee engagement, and business outcomes: A meta-analysis. Journal of Applied Psychology, 87(2), 268–279. pubmed.ncbi.nlm.nih.gov/12002955
- Holtom, B., Baruch, Y., Aguinis, H., & Ballinger, G. A. (2022). Survey response rates: Trends and a validity assessment framework. Human Relations, 75(8), 1560–1584. doi.org/10.1177/00187267211070769
- Huebner, L.-A., & Zacher, H. (2021). Effects of action planning after employee surveys. Journal of Personnel Psychology. doi.org/10.1027/1866-5888/a000285
- Huebner, L.-A., & Zacher, H. (2023). The role of mean item ratings, topic distance, direct leadership, and voice climate in action planning after employee surveys. Acta Psychologica, 238, 103950. doaj.org
- Kahn, W. A. (1990). Psychological conditions of personal engagement and disengagement at work. Academy of Management Journal, 33(4), 692–724. doi.org/10.2307/256287
- Keiningham, T. L., Cooil, B., Andreassen, T. W., & Aksoy, L. (2007). A longitudinal examination of Net Promoter and firm revenue growth. Journal of Marketing, 71(3), 39–51. doi.org/10.1509/jmkg.71.3.39
- Macey, W. H., & Schneider, B. (2008). The meaning of employee engagement. Industrial and Organizational Psychology, 1(1), 3–30. doi.org/10.1111/j.1754-9434.2007.0002.x
- National Labor Relations Board (2017). Mek Arden, LLC d/b/a Arden Post Acute Rehab, 365 NLRB No. 109. Summary by Ogletree Deakins: ogletree.com
- Preston, C. C., & Colman, A. M. (2000). Optimal number of response categories in rating scales: Reliability, validity, discriminating power, and respondent preferences. Acta Psychologica, 104(1), 1–15. doi.org/10.1016/S0001-6918(99)00050-5
- Rogelberg, S. G., Luong, A., Sederburg, M. E., & Cristol, D. S. (2000). Employee attitude surveys: Examining the attitudes of noncompliant employees. Journal of Applied Psychology, 85(2), 284–293. doi.org/10.1037/0021-9010.85.2.284
- Rogelberg, S. G., Conway, J. M., Sederburg, M. E., Spitzmüller, C., Aziz, S., & Knight, W. E. (2003). Profiling active and passive nonrespondents to an organizational survey. Journal of Applied Psychology, 88(6), 1104–1114. doi.org/10.1037/0021-9010.88.6.1104
- Saris, W. E., Revilla, M., Krosnick, J. A., & Shaeffer, E. M. (2010). Comparing questions with agree/disagree response options to questions with item-specific response options. Survey Research Methods, 4(1), 61–79. ojs.ub.uni-konstanz.de/srm/article/view/2682
- Schaufeli, W. B., Salanova, M., González-Romá, V., & Bakker, A. B. (2002). The measurement of engagement and burnout: A two sample confirmatory factor analytic approach. Journal of Happiness Studies, 3, 71–92. doi.org/10.1023/A:1015630930326
- Schaufeli, W. B., Bakker, A. B., & Salanova, M. (2006). The measurement of work engagement with a short questionnaire: A cross-national study. Educational and Psychological Measurement, 66(4), 701–716. doi.org/10.1177/0013164405282471
- Schaufeli, W. B., Shimazu, A., Hakanen, J., Salanova, M., & De Witte, H. (2019). An ultra-short measure for work engagement: The UWES-3 validation across five countries. European Journal of Psychological Assessment, 35(4), 577–591. doi.org/10.1027/1015-5759/a000430
- Schaufeli, W. B., & Bakker, A. B. (2003). Utrecht Work Engagement Scale, English 17-item form with terms of use. wilmarschaufeli.nl
- U.S. Equal Employment Opportunity Commission (2000). Enforcement guidance on disability-related inquiries and medical examinations of employees under the ADA. eeoc.gov
- van Sonderen, E., Sanderman, R., & Coyne, J. C. (2013). Ineffectiveness of reverse wording of questionnaire items: Let’s learn from cows in the rain. PLoS ONE, 8(7), e68967. journals.plos.org
- Wanous, J. P., Reichers, A. E., & Hudy, M. J. (1997). Overall job satisfaction: How good are single-item measures? Journal of Applied Psychology, 82(2), 247–252. doi.org/10.1037/0021-9010.82.2.247
Frequently asked questions
How many questions should an employee engagement survey have?
For an annual survey at a company with 10 to 250 employees, 20 to 30 closed items plus two or three open questions is usually enough and fits within about ten minutes. Research by Galesic and Bosnjak (2009) shows that longer announced survey times reduce the share of people who start, and answers late in a long questionnaire become less careful.
What is the difference between engagement questions and satisfaction questions?
Satisfaction questions ask how people evaluate their job or its conditions. Engagement questions ask about the experience of the work itself, such as energy, dedication and focus. The two are related but distinct: a meta-analysis by Christian, Garza and Slaughter (2011) found a corrected correlation of .53 between engagement and job satisfaction.
Should engagement surveys be anonymous?
They should at least be confidential, with clear rules about who sees what. The most important protection is a minimum reporting group, commonly five responses, below which no result is shown. Tell employees honestly whether the survey is anonymous or confidential; promising anonymity that small-group reports cannot deliver damages trust.
What response rate is good enough?
Published organizational surveys averaged 52.7 percent in Baruch and Holtom’s 2008 review and 68 percent in 2020 according to Holtom and colleagues (2022). More important than the rate is whether dissatisfied employees are missing. In small companies, also check the margin of error: with 30 responses from 48 employees, a percent-favorable result is only precise to about ±11 points.
Can I use the Utrecht Work Engagement Scale in my company survey?
According to the authors’ terms of use, the UWES is free for non-commercial scientific research, while commercial or non-scientific use requires prior written permission. Contact the authors before using it in an internal company survey, or write your own outcome items and test their reliability.

Next step
Show Candidates What Your Team Says
Top Employer (USIQ) combines a confidential employee survey with an HR assessment against 39 published criteria. One-time packages start at $2,990.
Which retention levers actually reduce quits? A research-based ranking with current BLS quit data, a decision table and a 90-day plan for U.S. employers with 10 to 250 staff.

Where a Top Employer seal works hardest in recruiting, how to describe it accurately and which wording to avoid once your company is certified.

Six practical steps from “we think we are a good place to work” to a seal your candidates can check, and why most of the work happens before you apply.